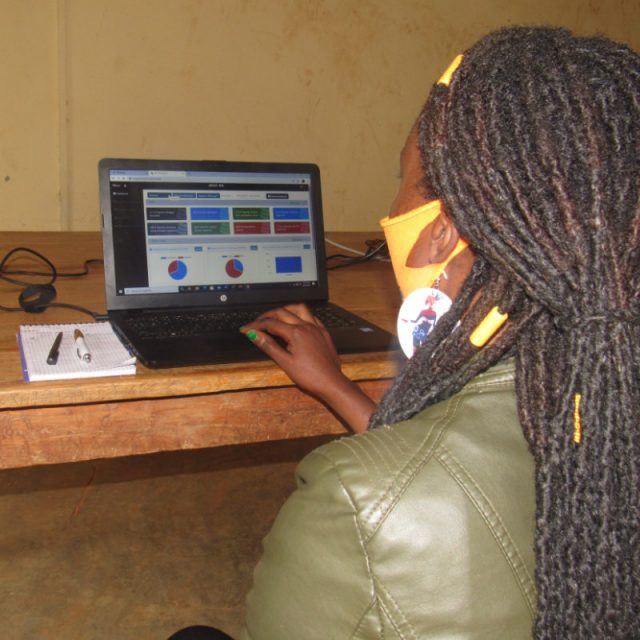
We monitor and report through a Web-Dashboard. You can manage access rights, edit data and display information in specific formats. The dashboard can be linked to our tools that Collect and Analyze data. We use open source solutions to present the data in a spatially explicit format through an inbuilt WebGIS.
The user interface is intuitive and highly customizable to your requirements. Updates and analyses happen automatically when new data arrives.

WebGIS
The WebGIS visualizes spatial data and offers tools for further analyses. You can manage different layers, filter for desired information and measure areas and distances.
Key features
- Stand alone tool or integrated into Web-Dashboard
- Open Source technology: PostgreSQL/PostGIS, Geoserver and Openlayers
- Customizable interactivity for data filtering, data import and export
- On-screen digitization and import of data in different formats
- Visualization of results
- Basic measurement tools
- Web Map Service enabled
- Use the postGIS DB in your system directly
Web-Dashboard
The online Web Dashboard is where it all comes together: access your data, analyze and monitor indicators, create automated reports and GIS-based visualization.
Key features
- Highly customizable
- Presentation of results and data chosen formats
- Own analysis with inbuilt pivot function
- User login management
- Interface for data integration in own web modules
- Automated data processing based on incoming data
- Templates for automated reporting


Geospatial solutions
Our geospatial data science team uses in-house developed EO tools and methods to monitor, report and verify past and ongoing processes and changes to forests and land use. Using cutting edge algorithms, Earth Observation datasets, Python, LizMap and Google Earth Engine, we create tailor made services and products for our clients.
Key features
- Tools for Carbon & climate project design (scoping, feasibility & eligibility assessment, similarity assessment)
- Monitoring, reporting and verification (damage, deforestation and degradation, spatiotemporal changes, time series analysis, statistical analysis, GHG emissions from croplands, soil erosion, risk analysis)
- Carbon stocks and biomass (forest inventory analysis using remote sensing, forest biomass from LiDAR)
- Geospatial tools for data processing and visualization (GeoCMS, LizMap, Processing Sentinel-2, Planetscope, NICFI and SAR data)
- Web Map Service enabled
- Use the postGIS DB in your system directly